Efficiently Displaying Objects in Jupyter Notebooks in Tables
Written on
Chapter 1: Introduction to Jupyter Notebooks
Jupyter notebooks serve as an exceptional platform for exploring concepts and drafting scientific or mathematical texts. However, a recurring frustration is the challenge of positioning objects alongside one another. By default, when you output multiple objects, they are displayed vertically, one below the other. Thankfully, there is a method to arrange them horizontally, and this guide will illustrate how to achieve that.
This paragraph will result in an indented block of text, typically used for quoting other text.
Section 1.1: Creating an Integral Table
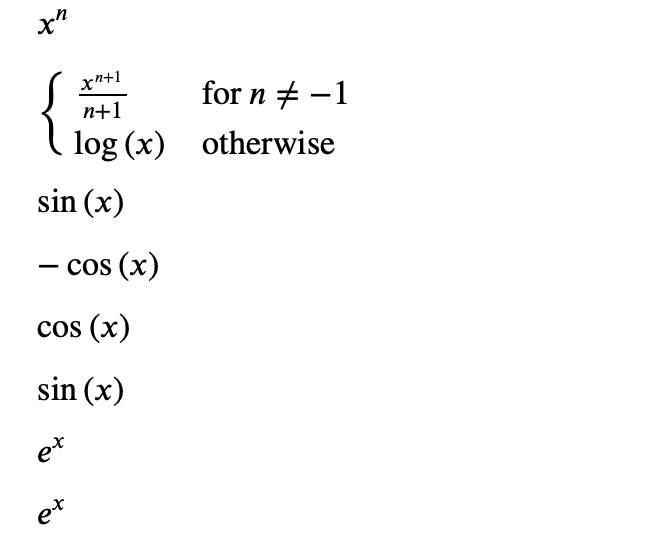
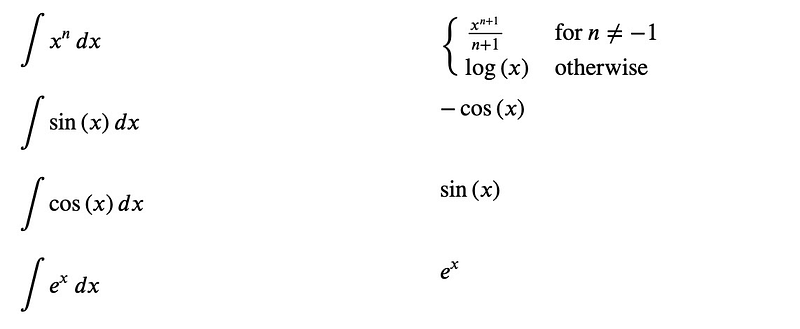
Let’s consider the task of constructing a simple integral table. The first column will represent the integrand ( f(x) ), while the second column will show the indefinite integral.

Using the sympy library, one might typically initiate the following code, which would display the results vertically—definitely not our desired outcome:
from sympy import *
from sympy.abc import x, n
fs = [x**n, sin(x), cos(x), exp(x)]
for f in fs:
display(f)
integ = integrate(f, x)
display(integ)

To present multiple items in a horizontal format, the ipywidgets package can be utilized. First, install it via pip:
pip install ipywidgets
The ipywidgets library includes a variety of standard widgets, such as input fields, buttons, sliders, and color selectors. For our purpose, we will use the Output widget, which is particularly useful as it can display any rich output from IPython. The layout of our table will be managed by another class from ipywidgets: GridspecLayout. Its interface is quite user-friendly, and it is beneficial to encapsulate it within a function:
from ipywidgets import GridspecLayout, Output
def display_table(table_data):
"""Display data in a table layout in Jupyter."""
nrows = len(table_data)
ncols = len(table_data[0])
grid = GridspecLayout(nrows, ncols)
for row_idx, row_data in enumerate(table_data):
for col_idx, col in enumerate(row_data):
out = Output()
with out:
display(col)
grid[row_idx, col_idx] = out
display(grid)
By utilizing this function, we can systematically compile the items we wish to exhibit, row by row, and then invoke our helper function:
from sympy import *
from sympy.abc import x, n
fs = [x**n, sin(x), cos(x), exp(x)]
rows = []
for f in fs:
integ = Integral(f, x)
result = integrate(f, x)
rows.append([integ, result])
display_table(rows)

And there you have it! The GridspecLayout allows for extensive customization, enabling you to modify its appearance using the full capabilities of CSS. However, this brief guide is designed to help you get started and point you in the right direction for further exploration.
Chapter 2: Enhancing User Interfaces in Jupyter
To further improve your experience with user interfaces in Jupyter notebooks, check out the following video.
The first video titled "Creating great user interfaces on Jupyter Notebooks with ipywidgets" by Deborah Mesquita provides valuable insights into enhancing the interactivity of your notebooks.
For those interested in working with data in Jupyter, the next video offers practical advice.
The second video, "Playing with Data in Jupyter Notebooks with VS Code," will guide you through effective data manipulation techniques.